Corporate giving
 Sponsorship
 Legacy giving
 Donate most needed food
 First Responders to Food Bank 365
 EAT 365
 Ways to give
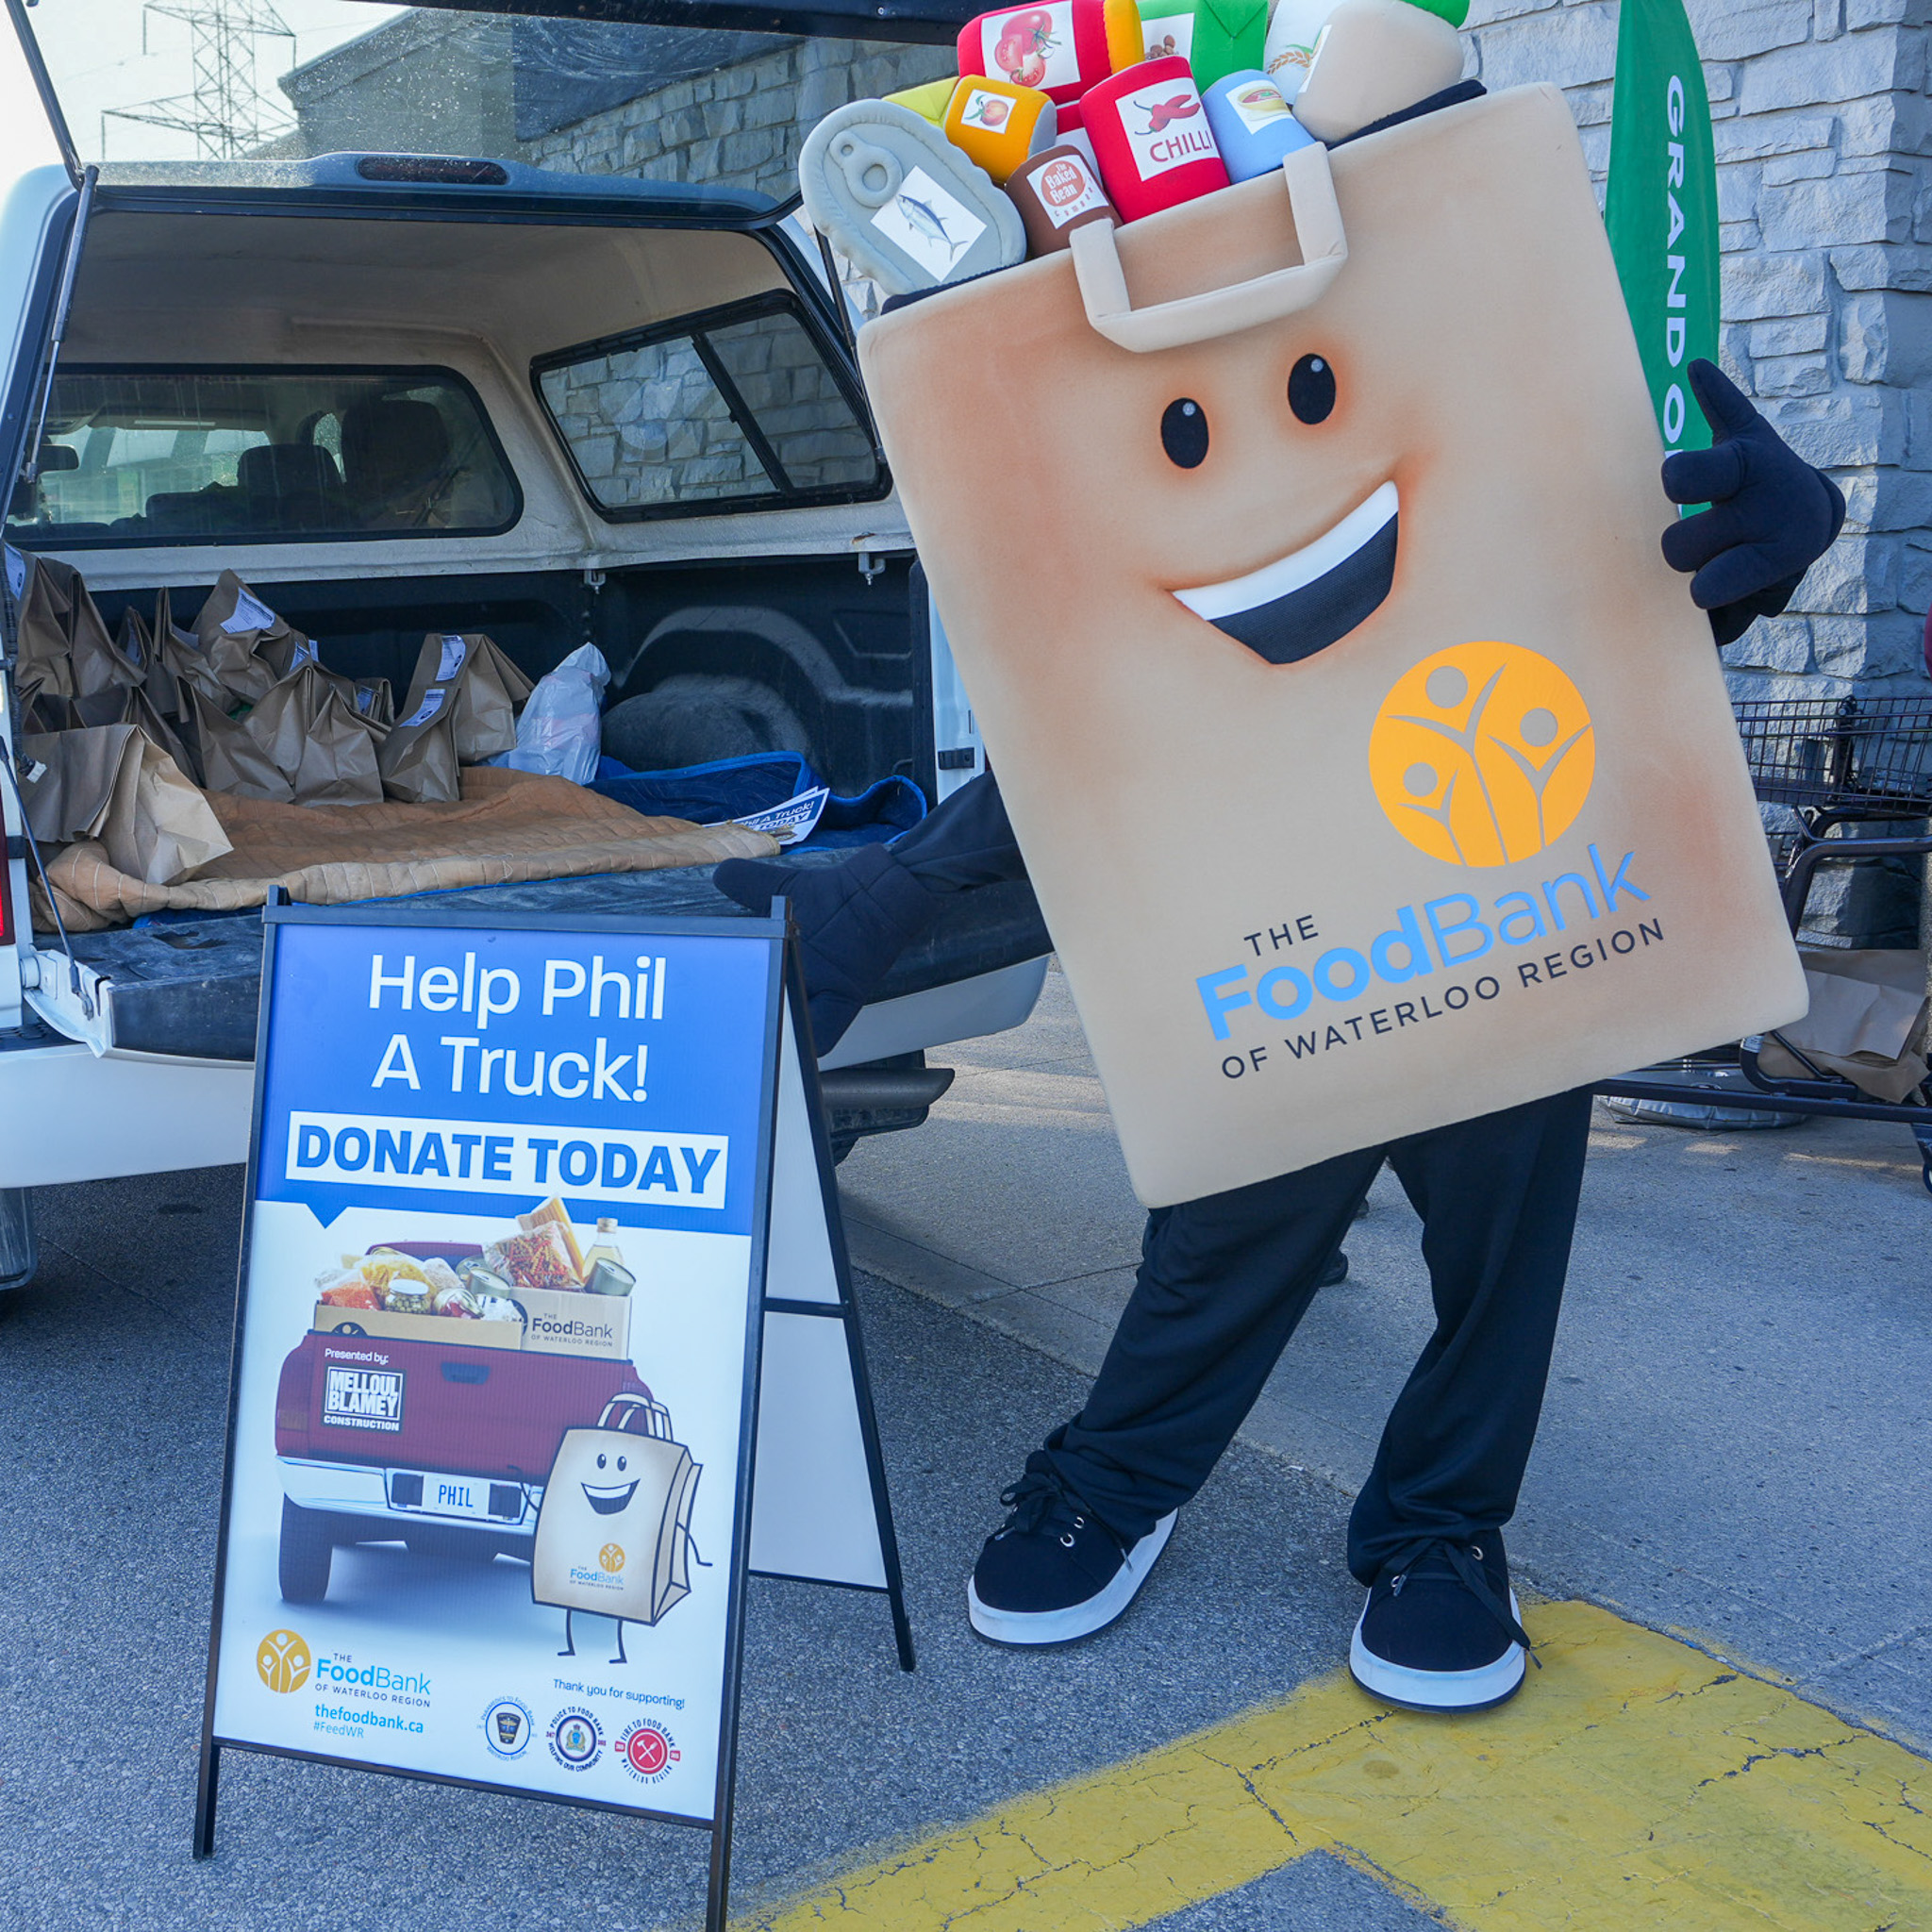
 Host a food and fund drive
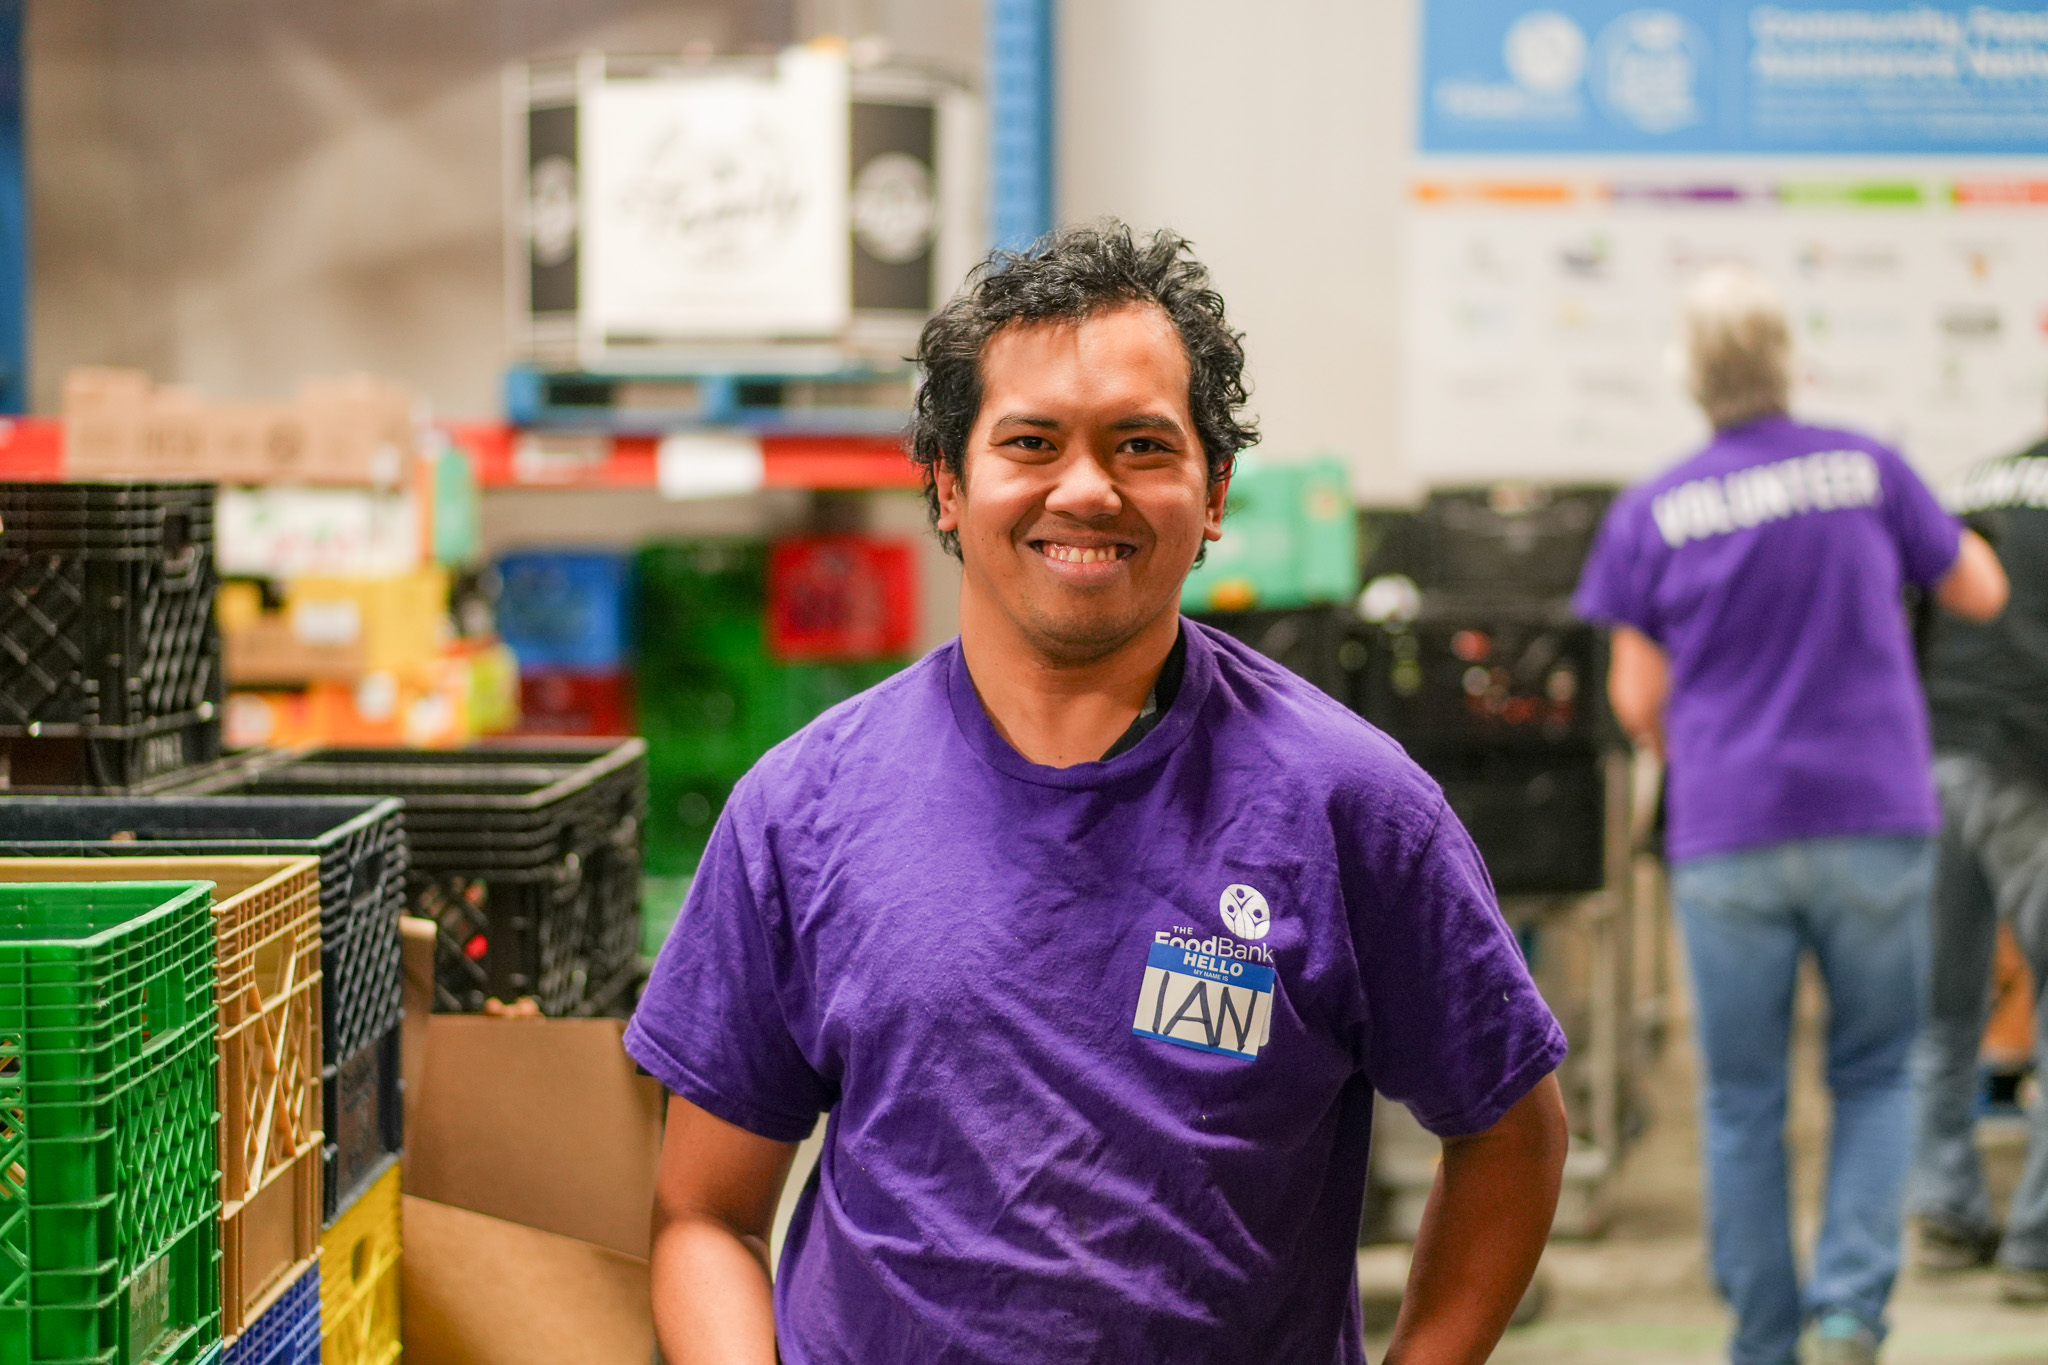
 Volunteer
 Events
 Advocate
 Get involved
 Mobile Pantry
 Food Recovery program
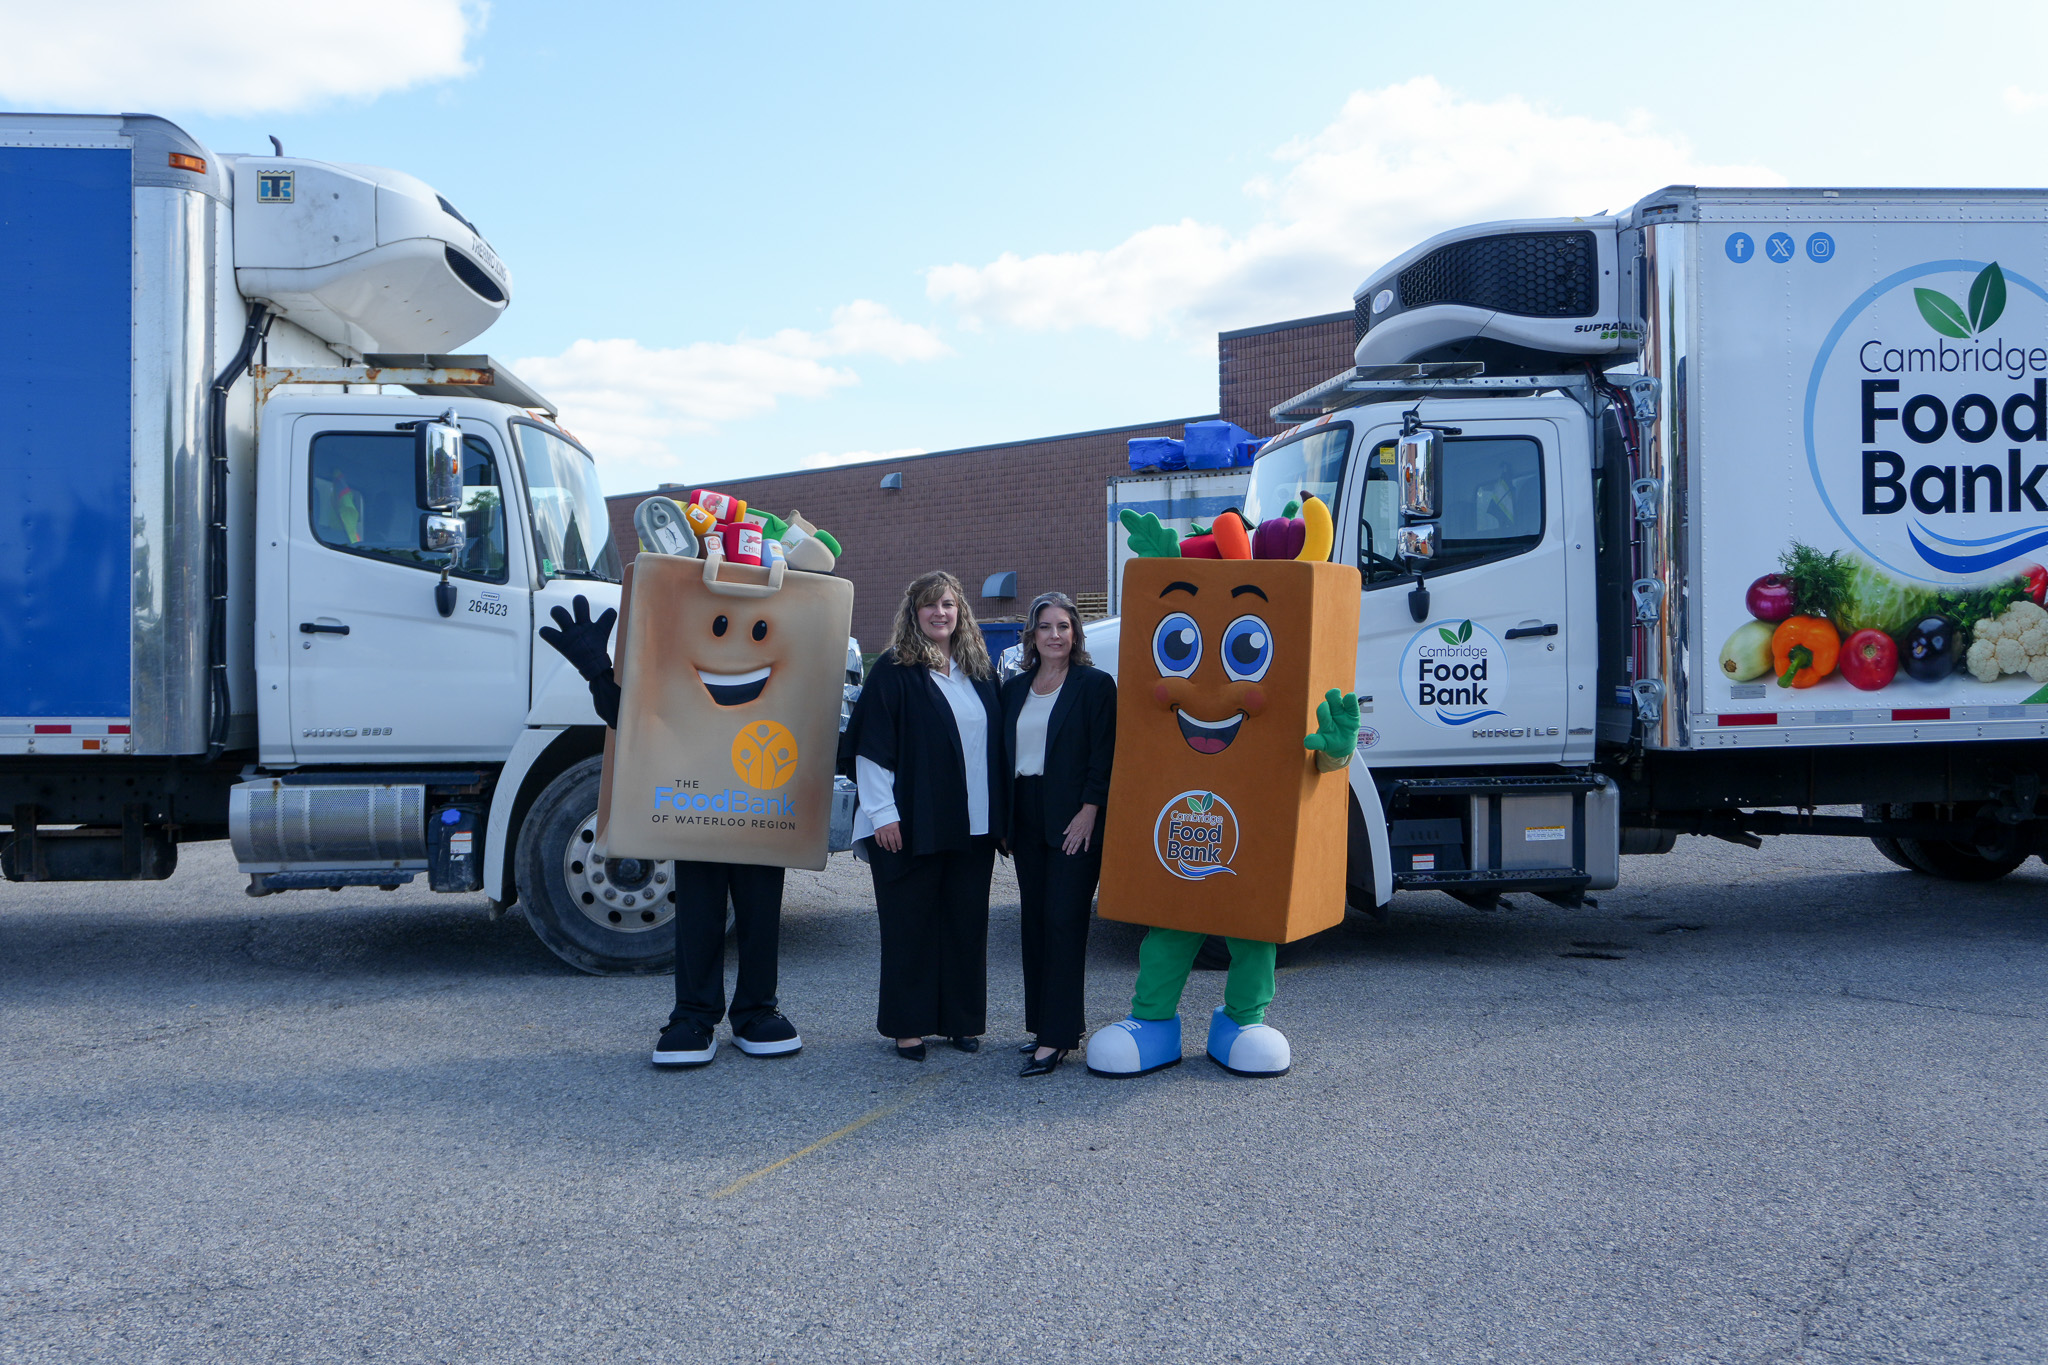
 Feed Collaboration
 Fresh Approaches Food Centre
 Perishable hamper line
 Our team
 Community Food Assistance Network
 Plans and reports
 Careers
Library
Read inspiring stories from community members, local businesses, and our Community Food Assistance Network. Find easy, delicious recipes to try at home. Discover meaningful ways to support your neighbours facing hunger. Stay up to date with our latest news and media releases.
All this and more—right here in one place!